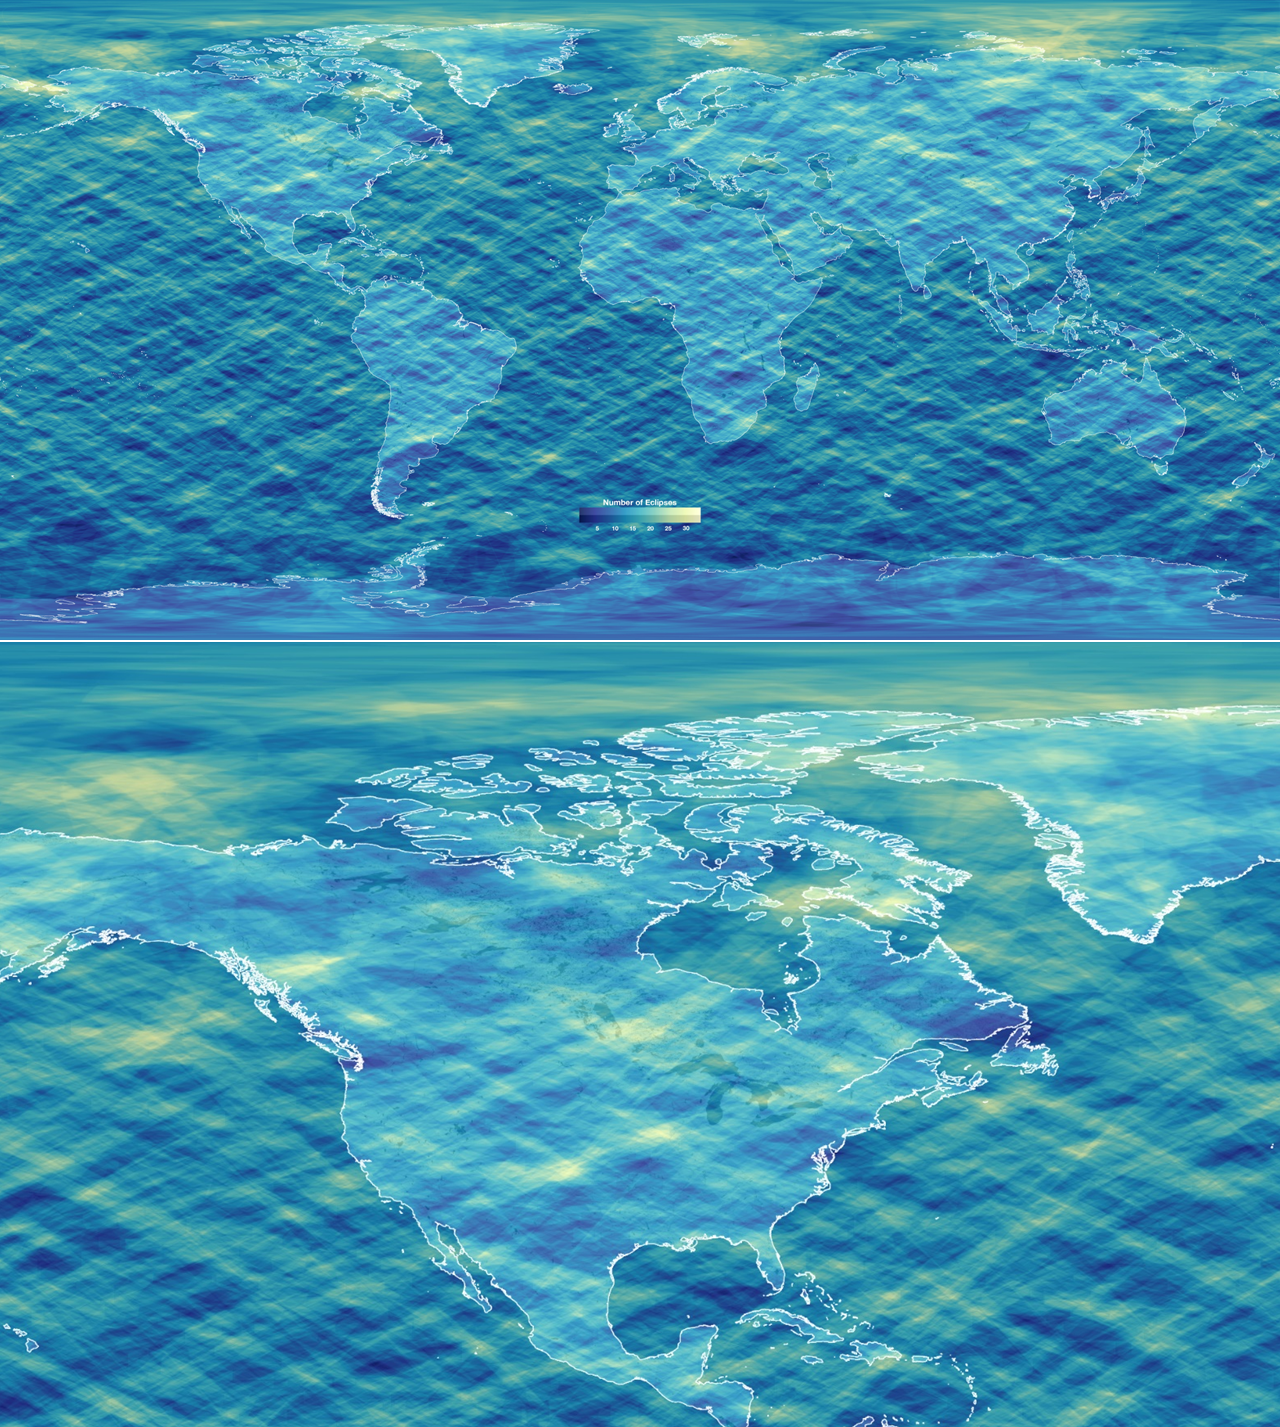
A heatmap showing the frequency of total solar eclipses over the 5000 years from 2000 BCE to 3000 CE.
https://cdn.fosstodon.org/media_attachments/files/112/227/417/111/962/751/original/0dcc8a3f61a52055.png
The following graphic shows a heatmap of the density of total solar eclipse paths over Earth during the 5000-year period between 2,000 BCE and 3,000 CE. Lighter shades mean higher density.
The bias towards the northern hemisphere is clear. The values for longitude points are slightly smeared because the graph has not been corrected for the variance in rotational speed of the Earth.
On average, a given spot on Earth experiences a total eclipse every 366 years.
bartle is a social network. It runs on GNU social, version 2.0.1-beta0, available under the GNU Affero General Public License.
![]() All bartle content and data are available under the Creative Commons Attribution 3.0 license.
All bartle content and data are available under the Creative Commons Attribution 3.0 license.